


Want a heads up when a new story drops? Subscribe here.
The value of information is unquestionable when it is clearly presented and free of bias and distortions. But even when it is understandable and free of contradictions, a wealth of information can cause reduced understanding, lack of engagement, and as Herbert Simon nicely formulated it – poverty of attention. Information overload, also known as data smog, infoxication, and infobesity, not only makes people spoilt for choices but reduces their capacity to learn new things and engage in productive problem-solving.
Table of Contents
Facing the Information Overload Problem
The reasons why we are drowning in information are many: deregulation and globalization intensify competition; the volume of business communication has increased, including with stakeholders, suppliers, and customers; and there are so many ways in which we can communicate nowadays – via video conferencing, email, voice mail, fax, phone, and in-person. The rate of data generation is impressive, whether graphs, multimedia, blog posts, news, scholarly articles, case studies, or e-books.
Information overload can cause confusion and result in sub-standard choices. Consumers who are confused often face results such as choosing without thinking, shopping fatigue, picking the wrong products and services, postponing a purchase, and being disappointed after making undesirable purchases. All these result in reduced brand loyalty and trust, with companies trying their best to engage the disengaged.
That is a lot of work for marketing departments and should be done right. Unfortunately all too often businesses use the wrong marketing tools to engage with customers and improve brand awareness. According to the 2018 B2B Content Marketing report, a good number of advertisers use infographics (65 percent) but this figure is lower compared to videos (72 percent), case studies (73 percent), and social media posts (94 percent).
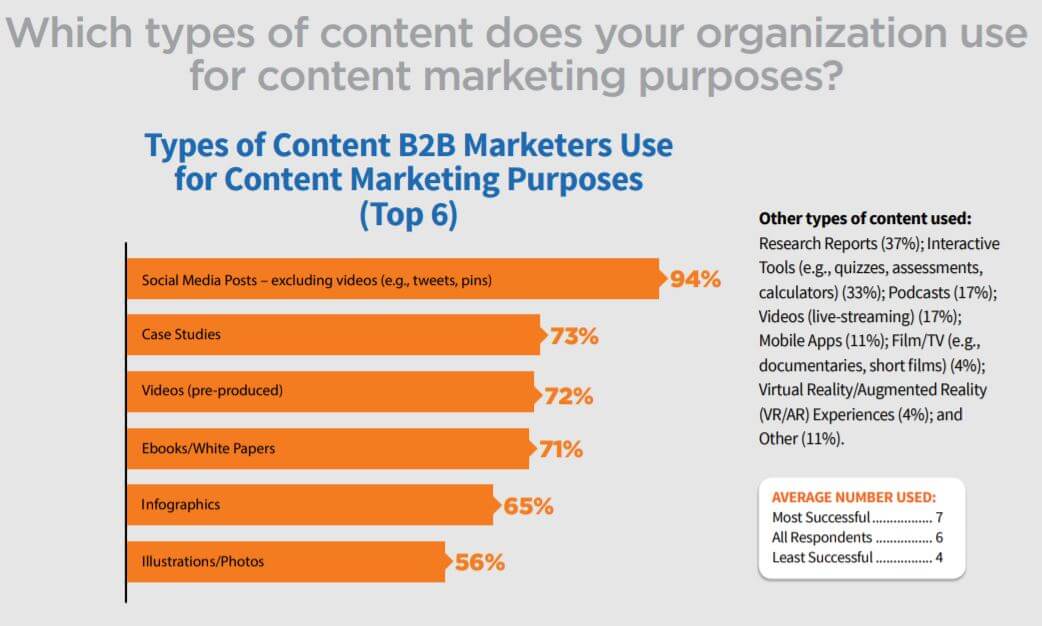
Credits: Content Marketing Institute/MarketingProfs
And while more and more businesses include infographics in their marketing strategies, it is also important to use them effectively. Here is how to use them and why.
1. More Engaging Content
Infographics appeal to us because we are visual creatures. A number of research studies have been carried out to examine the link between color and human personality. Painting and Personality: a Study of Young Children by Berta Weiss Hattwick and Rose H. Alschuler, for example, reveals that the drawings of children tell a lot about the personality traits that drive their behaviors, feelings, and thoughts. Yellow shows dependence and infantilism, red indicates uninhibited expression, blue is self-control, and green indicates balance. Faber Birren’s theory is also based on the assumption that colors trigger emotions and influence the way we express feelings and communicate thoughts. Emotionally responsive persons are more affected than introverts.
Images also influence purchasing decisions. An article by Satyendra Singh published in Management Decision shows that color makes for 62 to 90 percent of the assessment when choosing from different products.
The reason why visual content sells is that it evokes feelings that engage readers. Which makes infographics a powerful marketing tool – they are highly visual.
Choosing the right color is important, however, based on the message you are trying to convey. Yellow and orange are usually seen as optimistic and cheerful while red is interpreted as risky, exciting, daring, and new. Purple is perceived as high-end and unique while blue stands for honesty, cheerfulness, and sincerity.
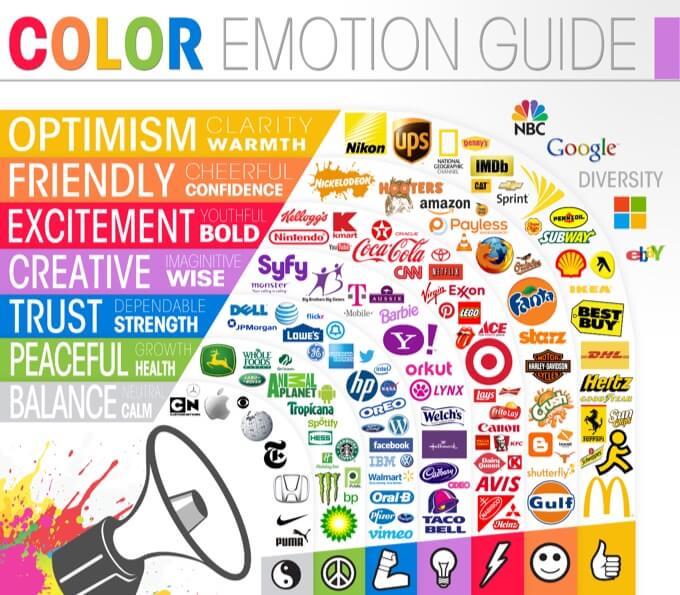
Credits: The Color Emotion Guide Infographic; TheLogoCompany.Net
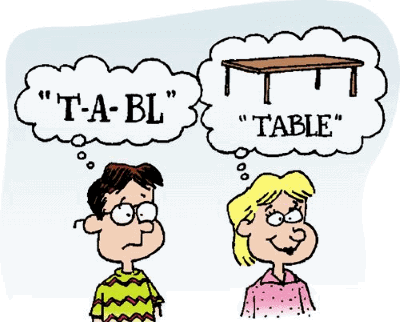
2. Easy to Comprehend
Using a combination of text and images makes content easy to digest. A study by Martina Ehlers and Ros Dowse published in Clinical Trial proves this. The study shows that including pictograms in medical labels helps improve comprehension rates and adherence. In the course of the study, the experimental group received text with pictogram labels while the control group was given text only. The rate of adherence was shown to be over 90 percent for 54 percent of participants in the experimental group and just 2 percent for those in the control group. According to the researchers, visual content facilitates comprehension and contributes to adherence.
People are also better at following directions when reading an illustrated text. Learning from Visuals by Rune Pettersson shows that readers fare better when content illustrations are transformational, interpretational, organizational, or representational. They are more likely to follow directions when visual content is representational meaning that it reinforces the main themes and points of a story. Transformational illustrations give text a specific form that helps improve retention while interpretational visuals facilitate comprehension for content that is hard to understand. Organizational illustrations add structure and framework as people are better at retrieving organized content.
Other researchers juxtapose written text and visual content Paul Lester, professor at the California State University explains that words are seen as repressive and reminiscent of an era when verbal messages were used to enforce socially acceptable behaviors. Unlike words, images are captivating, easy to understand and remember, and can serve as a medium of expression.
Infographics serve the exact same purpose in that they make complex narratives easy to grasp. As they are highly visual, information is communicated more effectively and quickly, helping readers to understand complex procedures and processes.
3. Easy to Retrieve
Studies show that people only remember 10 – 20 percent of what they read. Published back in 1967, Are You Missing the Boat in Training Aids by Treichler illustrates this. People understand 90 percent of what they say while doing it, 70 percent of what they say, 50 percent of what they hear, and only 10 percent of what they read. When it comes to visual content, research published by 3M shows that images make learning up to 400 times more effective because they help capture interest and improve understanding.

Credits: Text vs. Images: Which Content Format is Effective? by Easel.ly
Multiple studies also show that infographics help retrieve information more effectively than other types of content. The 2018 report by IGW reveals that 61 percent of users find infographics helpful in retrieving information, followed by commercials (55 percent), PowerPoint presentations (48 percent), and articles with images (46 percent).
4. Helps Avoid Information Overload
What makes infographics so appealing is the fact that they make abstract and complex matters simple and concrete and illustrate patterns in large amounts of data. Processing huge amounts of information often results in overload that many of us are trying hard to avoid.
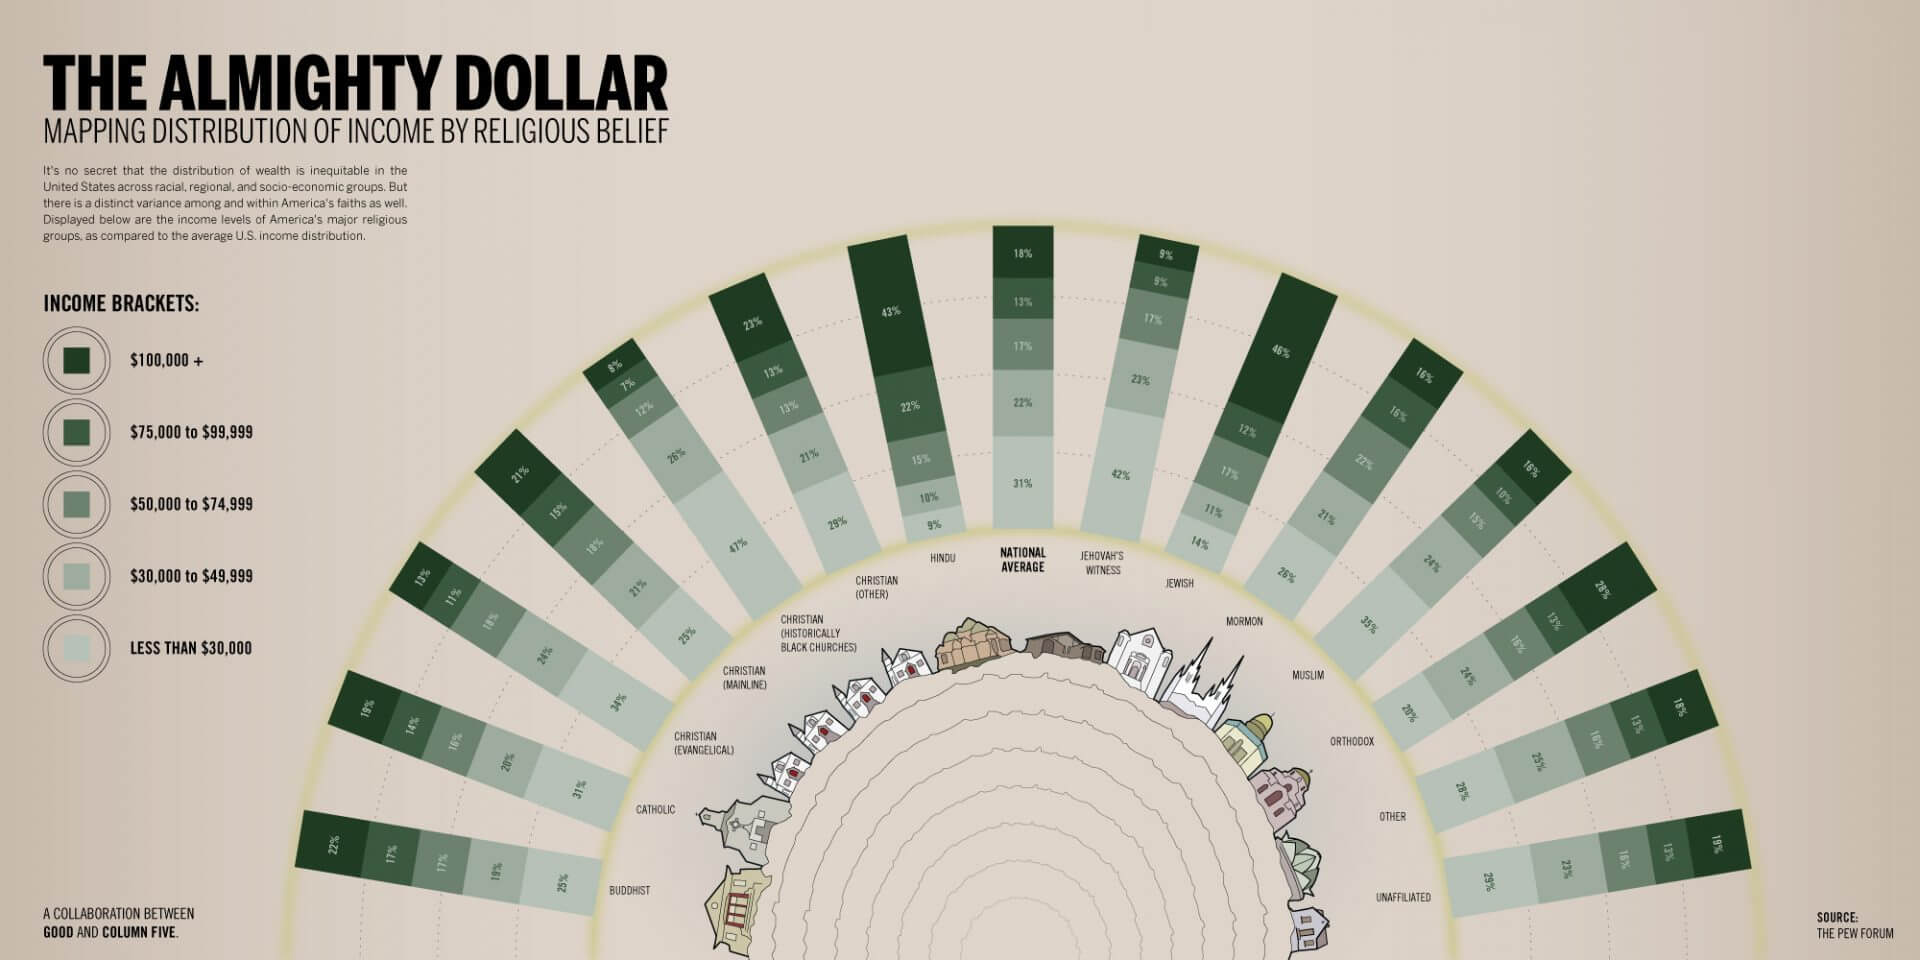
Credits: Example of an infographic that illustrates a lot of data in a simple and easy-to-understand manner. The Almighty dollar by Good and Column FIve.
Overload is typically caused by irrelevance and abundance and the existence of different sources that compete for attention. The excessive quantity of information we are bombarded with daily can feel like crushing us. It can cause sensory overload and symptoms such as restlessness, irritability, anxiety, fear, and stress, which affect productivity, performance, and quality of life.
To assess the extent to which we suffer from overload, researchers at the University of California looked at three indicators: bytes, words, and hours consumed on an average day. They found out that Americans consume 34 gigabits, 100,500 words, or almost 12 hours on any given day. Information takes a variety of formats, including self-generated, person-to-person, digital, analogue, video, pictures, and electronic and print media. It is delivered for different purposes such as communication, entertainment, and meeting work objectives. Sources range from internet video and computer games to books, magazines, and newspapers. The list of sources that we use is quite impressive and explains why we suffer from information overload:
- Recorded music
- Music in theatres and opera houses
- Offline computer programs
- Handheld gaming
- Console games
- High-end computer gaming
- Cellular voice
- Fixed line voice
- FM and AM radio
- Satellite radio
- Books
- Leaflets, flyers, and brochures
- Mobile and satellite TV
- Cable TV
- DVD
The list goes on. But the reason why we are drowning in information is not only its overabundance but also the fact that it is often of poor quality. Indicators that are useful in measuring value include comprehensiveness, clarity, applicability, consistency, and accuracy. Other indicators to assess value are reliability, accessibility, traceability, and conciseness. It is content that is not up to the point and is obsolete, difficult to understand, and full of contradictions that causes overload.
When value indicators are accounted for, infographics can help counter overload. Good information graphics only include essential text and get straight to the point by using numbers, statistics, and facts. As lecturer Charles Gibbons in the Graphic Design Certificate Program nicely formulated it, infographics help us “tell clear, compelling stories”.
5. Choice of Formats
Visual content comes in different types, thus allowing marketers to choose a format that best fits into their content creation strategy. The most common types are:
- Visual resume
- Timeline
- Data visualization
- Interactive
- Visual article
- Comparison
- List-based
Choosing the right type helps businesses target specific audiences that are interested in their products. A list-based infographic, for example, is great to use when you want users to pay attention to important content. A comparison infographic, on the other hand, shows similarities and differences or advantages and disadvantages to help users make a comparison. The interactive variety includes elements like text, graphs, charts, illustrations, imagery, and questions and pop-ups. It can be used to engage specific audiences such as Generation Z, Millennials, and creative thinkers. The type of infographic to choose depends on your marketing objectives – whether you want to visualize your customer journey, focus on key concepts, educate users about your business to increase brand visibility, or anything else.
6. Social Media Users’ Favorite
Infographics are users’ favorites when it comes to sharing. To illustrate this, Neilpatel gives examples of pieces that went viral. Created by Cavna, The Complete Social Media Image Size Guide generated more than 10K social media shares.
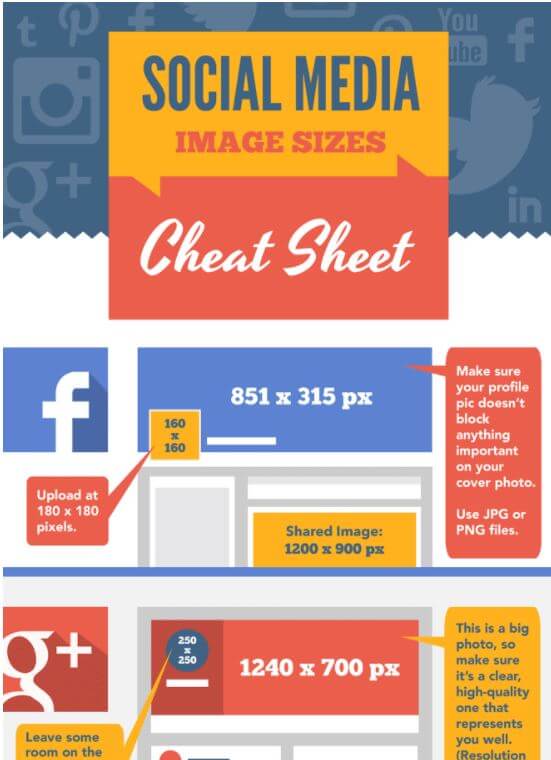
Credits: An excerpt of Janie Kliever’s Social Media Image Sizes Infographic
Another infographic titled 15 Grammar Goofs That Make You Look Silly generated a total of 263K shares and not only because of the popularity of its creator Copyblogger. What Brian Clark did was to diversify his promotional strategy by getting interviewed, joining other users’ podcasts, etc.
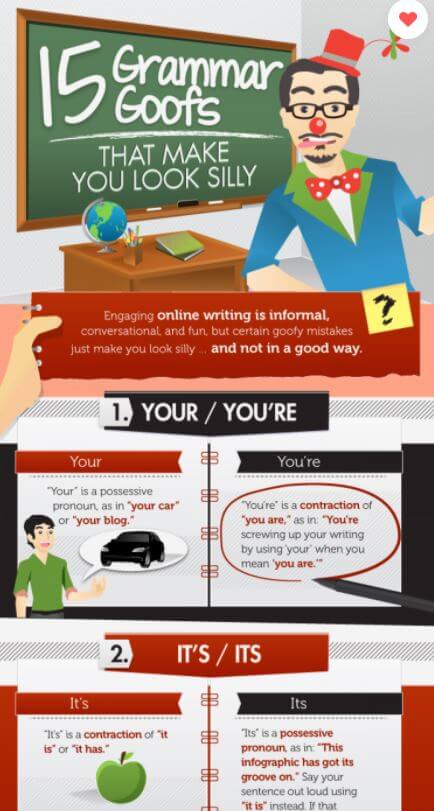
Credits: Excerpt from Coppyblogger’s 15 Goofs That Make You Look Silly Infographic
Infographics can and do go viral. And when users share content that they like they help drive referral traffic. All you need to do is add widgets and share buttons. When deciding which social media channels to use, it is important to factor in your target audience. Facebook users are more likely to share information graphics and charts as well as entertainment and health-themed infographics. The type of content that Twitter users typically share includes sports, entertainment, and career-related pieces. Content related to business, finance, and career development is most often shared by LinkedIn users while Pinterest is your best bet for infographics about lifestyle, food, and health.
7. Visuals Are Effective
As visual content enjoys mass appeal, more and more businesses rely on information graphics to boost their promotional strategy. A survey by marketing agency Infographic World reveals that visual content marketing is a preferred choice compared to podcasts, articles, blogs, and video. In fact, 56 percent of survey respondents shared they had used infographics and 84 percent found them to be effective in meeting their sales and marketing objectives.
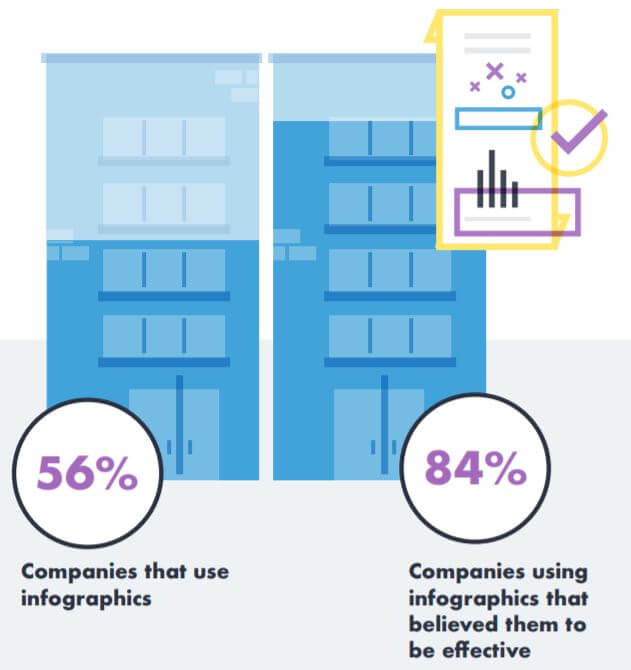
Credits: Excerpt from IGW’s The State of Infographics
The majority of participants or 83 percent used visuals for marketing, 70 percent to drive sales, 59 percent to create internal presentations, and 43 percent for in-company trainings.
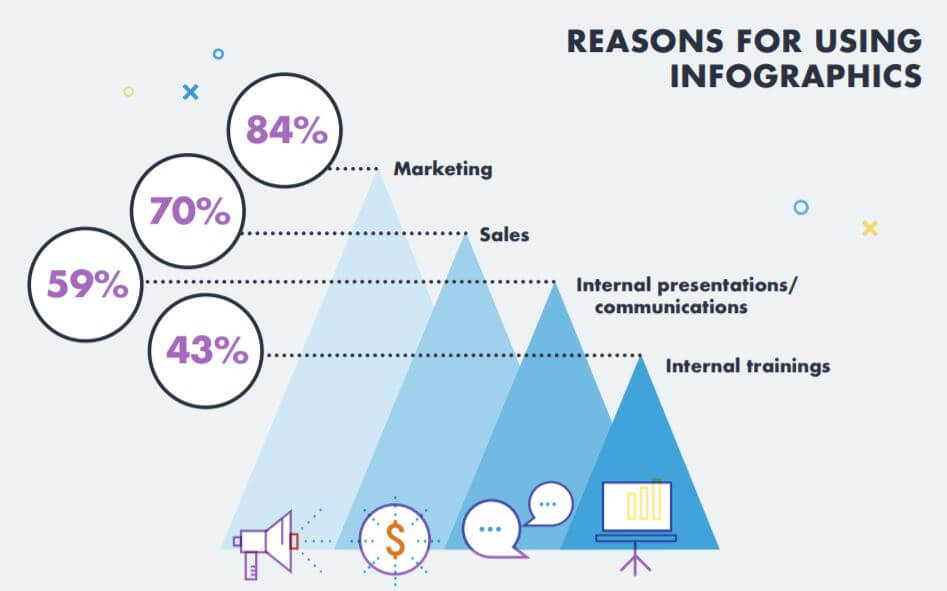
Credits: Excerpt from IGW’s The State of Infographics
8. Facilitate Learning
What makes infographics good learning aids is the fact that they incorporate visual cues. As you probably know, human thought is mostly visually based. Our brains absorb and process about 36,000 images every single minute. Research shows that up to 90 percent of the information that we get comes through the eyes, making visual processing the dominant mode, despite that the kinesthetic and auditory modes of perception also play a role.
Visual aids are also fundamental to constructing knowledge. Metacognition refers to the use of visual tools to describe cognitive processes that help organize knowledge. The tools that facilitate metacognition are thinking-process maps, task-specific graphic organizers, and brainstorming webs. Thinking maps, system diagrams, and concept mapping are examples of thinking-process maps. When we collect data, question, and apply past knowledge, we use thinking maps to turn information into knowledge. All this shows how crucial visual content is for learning. We use visual aids to integrate new information into existing knowledge which we can later apply to new situations. In classrooms, learning tools that combine text and images help simplify content, improve vocabulary, and keep students engaged. Such aids can also be used by brands to simplify content, be it a business report or product demo, thus enabling audiences to learn faster and retain information for longer.
9. You Are the Expert
Creating a visually compelling and information-rich infographic takes experience, skill, knowledge, time, and effort. This turns you into an expert as no one knows more than you do. When the subject comes into the spotlight once again, your audience will trust you as an expert, which is a pretty good position to be in. Experts are seen as persons who help increase understanding, enable others to see things from a fresh perspective, and offer options and not just judgments.
10. Content That Is Easy to Analyze
Basically you can use the metrics that you normally do to determine whether your infographic marketing campaign has been successful in engaging your target audience. You can view clicks to your landing page from ads, networks, and referring pages or you can track shares on social media. The key performance metrics to focus on are authority, engagement, conversions or sales, and traffic, including unique pageviews, pageviews, and users. General indicators to track are:
- Returning users
- Traffic sources
- Pages per session
- Dwell time
- Organic traffic
- Existing leads touched
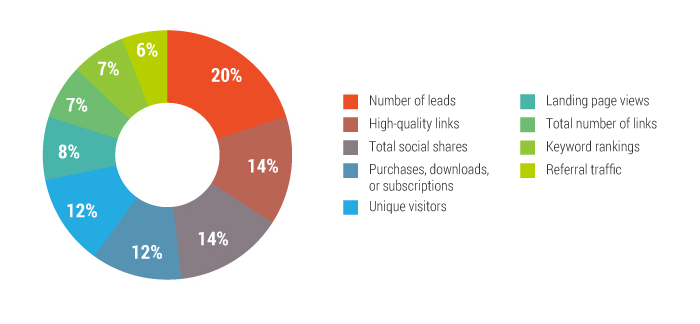
Credits: Top Three Metrics Clients Use to Measure Content Marketing Success by Fractl and MOZ
It is also important to track engagement metrics, including likes, re-publications, mentions, and comments as these are indicators of popularity and audience involvement. This will show you whether your marketing campaign has been successful in involving your audience into your narrative.
Takeaways
Infographics help present information in a simple but interesting way, thus enabling users to easily digest it. They allow marketers to condense information without impacting accuracy, meaning, or quality. Using infographics enables businesses to convey and get their message across in a way their audiences will remember. When creating visual content, however, it is important to make sure it is unique to your brand and company, memorable, intriguing, tied to emotion, and relevant to your audience.
Remember that people have short attention spans. In fact, the collective attention span has been shown to be narrowing due to the sheer amount of information that we are flooded with. This effect occurs across a variety of domains, books included, and the main culprit is data flood, with content constantly increasing in volume. Humans are driven by an exploratory spirit, and marketers are in severe competition to offer something new, interesting, and engaging. Our desire for newness makes us switch between content quicker than ever because there is plenty of it. What this means for businesses is that they compete for the attention of consumers who lose interest quickly. Using infographics can help brands capture short attention spans as they are eye-catching and present information in an organized way. Drawing on imagery, content that is educational, interesting, and relevant offers consumers unique visual experience, keeping their focus glued to the messages brands are trying to convey.
Resources:
https://contentmarketinginstitute.com/wp-content/uploads/2017/09/2018-b2b-research-final.pdf
https://www.researchgate.net/publication/318653465_CONSIDERATIONS_REGARDING_USE_AND_ROLE_OF_COLOUR_IN_MARKETING
https://www.emerald.com/insight/content/doi/10.1108/00251740610673332/full/html
https://pubmed.ncbi.nlm.nih.gov/15950838/
https://www.researchgate.net/publication/281844294_Learning_From_Visuals
http://web.archive.org/web/20001102203936/http%3A/3m.com/meetingnetwork/files/meetingguide_pres.pdfhttp:/web.archive.org/web/20001102203936/http%3A/3m.com/meetingnetwork/files/meetingguide_pres.pdf
http://172yv5uzmfx1i8apy2vvn3vs-wpengine.netdna-ssl.com/wp-content/uploads/2017/10/Report-State-Of-Infographics.pdf
https://ijoc.org/index.php/ijoc/article/viewFile/1566/743
https://neilpatel.com/blog/content-marketing-case-study-how-4-infographics-generated-over-10000-social-shares/
http://www.mcoe.edu.my/Uploads/WMSTC2013_habits_of_mind.pdf


